SDG Fonds+
SDG Fonds+
SDG Fonds+

Supplier ESG issues: Researchpost 287

Green growth? Researchpost 286

Marcel Reyers zu Impact-Investments
Global Equity Small Cap Fonds
Hohe SDG-vereinbare Umsätze aller Portfoliounternehmen
Aktien aus diversen Gesundheits-, Industrie- u.a. Marktsegmenten
Hohe Best-in-Universe Umwelt-, Sozial- und Governance-Anforderungen
Umfassende Ausschlussliste (z.B. Tierversuche und Fleisch)
Umfassendes Shareholder Engagement
Wenige Überschneidungen mit anderen Fonds
Ziel: Smallcap-Performance mit besonders hoher Nachhaltigkeit
Dirk Soehnholz ist Berater des FutureVest Equity Sustainable Development Goals R Fonds (ISIN: DE000A2P37T6).
Der Fonds wird aktuell nur in Deutschland und Österreich öffentlich angeboten.
Eine institutionelle Anteilklasse und der Vertrieb in der Schweiz sind abhängig von Nachfragen bzw. Vertriebspartnern.
Bitte nehmen Sie Kontakt mit uns auf, wenn Sie den Fonds nicht bei Ihrem gewünschten Partner kaufen können.
Das Portfolio des Fonds basiert auf dem Global Equities ESG SDG Portfolio von Ende 2017. Der Fonds wurde im August 2021 aufgelegt. Er ist einer der wenigen global investierenden und besonders konsequent nachhaltigen Fonds mit Fokus auf kleine und mittelgroße börsennotierte Unternehmen.
Bei der Aktienauswahl wird vor allem darauf geachtet, dass die angebotenen Produkte und Dienstleistungen der ausgewählten Unternehmen möglichst gut mit den Nachhaltigkeitszielen der Vereinten Nationen (Sustainable Development Goals, SDGs) vereinbar sind. Im Gegensatz zu vielen anderen Nachhaltigkeitsfonds spielen dabei nicht nur ökologische, sondern auch soziale Aspekte eine wichtige Rolle.
Zudem müssen alle Aktien sowohl nach ökologischen und sozialen Kriterien als auch nach Kriterien der Unternehmensführung (E-, S- und G-Scoring) zu den Besten gehören. Damit soll verhindert werden, dass beispielsweise Unternehmen in den Fonds aufgenommen werden, die nur ökologisch gut, aber sozial schlecht sind. Es werden so genannte Best-in-Universe Scorings und nicht die sonst üblichen Best-in-Class Scorings verwendet. Damit soll ausgeschlossen werden, dass Unternehmen mit relativ geringen ökologischen Risiken aus einer Branche („Klasse“) mit insgesamt hohen ökologischen Risiken in das Portfolio gelangen.
Darüber hinaus werden Unternehmen mit Sitz in Ländern, die aus Rechtssicherheits-Sicht nicht als gut einzustufen sind, wie z.B. China, aus dem Portfolio ausgeschlossen. Hinzu kommen Komplettausschlüsse für zahlreiche Aktivitäten wie fossile und nukleare Energie, Tierversuche, Gentechnik, aber auch Fleisch, Glücksspiel und vieles mehr.
Mit Aktionärs-Engagement wird versucht, alle Unternehmen noch nachhaltiger zu machen.
Bester Impact Aktienfonds? Teste selbst!)
Maximale Portfolio-Nachhaltigkeit: Was geht?
Weiterführende Informationen siehe offizielle Fondsseite FutureVest Equity Sustainable Development Goals R mit
Factsheet
Kurzpräsentation (Fondsbroschüre)
Kurzvideo
Detaillierte Nachhaltigkeitsinvestmentpolitik inklusive Shareholder Engagementpolitik
Monatsbericht und monatlicher Nachhaltigkeitsreport
Engagementreport mit allen Fondspositionen

SDG-Investmentbeispiel 46: Deutsche Verkehrstechnik
Auch IVU erfüllt meinen wichtigsten Nachhaltigkeitsanspruch, nämlich Produkte oder Services anzubieten, die möglichst kompatibel mit den Nachhaltigen Entwicklungszielen der Vereinten Nationen (SDG) sind

SDG-Investmentbeispiel 45: US-Studienfinanzierer
aus dem von mir beratenen Fonds ist der US-Studienfinanzierer Sallie Mae (SLM). Auch SLM erfüllt meine Anforderungen von 100% SDG-vereinbaren SDG-Umsätzen und gute ESG-Scores.

SDG-Investmentbeispiel 44: Fernunis in Peru und Mexiko
Das SDG-Investmentbeispiel 44 aus dem von mir beratenen Fonds ist Laureate mit aktuell über 50 Campussen in Mexiko und Peru und über vierhundertsechzigtausend eingeschriebenen Studierenden. Auch Laureate erfüllt meinen wichtigsten
Die auf dieser Website zur Verfügung gestellten Informationen richten sich ausschließlich an Investoren, die ihren Wohnsitz in Deutschland und Österreich haben. Sie sind nicht als Verkaufsangebot oder Aufforderung zur Abgabe eines Kauf- oder Zeichnungsangebots für Anteile des auf dieser Website dargestellten Fonds zu verstehen und ersetzen nicht eine anleger- und anlagegerechte Beratung.
Anlageentscheidungen sollten nur auf der Grundlage der aktuellen gesetzlichen Verkaufsunterlagen (Basisinformationsblatt (BIB), Verkaufsprospekt und – sofern verfügbar – Jahres- und Halbjahresbericht) getroffen werden, die auch die allein maßgeblichen Anlagebedingungen enthalten.
Die Verkaufsunterlagen werden bei der Kapitalverwaltungsgesellschaft (Monega Kapitalanlagegesellschaft mbH), der Verwahrstelle (Kreisparkasse Köln) und den Vertriebspartnern zur kostenlosen Ausgabe bereitgehalten. Die Verkaufsunterlagen sind zudem im Internet unter www.monega.de erhältlich.
Die auf dieser Website zur Verfügung gestellten Inhalte dienen lediglich der allgemeinen Information und stellen keine Beratung oder sonstige Empfehlung dar. Die Kapitalanlage ist stets mit Risiken verbunden und kann zum Verlust des eingesetzten Kapitals führen. Vor einer etwaigen Anlageentscheidung sollten Sie eingehend prüfen, ob die Anlage für Ihre individuelle Situation und Ihre persönlichen Ziele geeignet ist.
Die Werte von Portfolios können sowohl steigen als auch fallen. Die Wertentwicklung in der Vergangenheit bietet keine Garantie für die zukünftige Entwicklung des Wertes einer Anlage. Folgende Risiken können in dem Fonds zum Tragen kommen:
- Aktienrisiko: Aktien unterliegen erfahrungsgemäß starken Kursschwankungen und somit auch dem Risiko von Kursrückgängen.
- Adressenausfallrisiko: Durch den Ausfall eines Ausstellers oder eines Vertragspartners, gegen den der Fonds Ansprüche hat, können für den Fonds Verluste entstehen.
- Liquiditätsrisiko: Der Fonds könnte zu einem geringen Teil seines Vermögens in Papieren angelegt sein, die nicht (mehr) an einer Börse oder einem ähnlichen Markt gehandelt werden.
- Währungsrisiko: Vermögenswerte des Fonds können in einer anderen Währung als der Fondswährung angelegt sein. Fällt der Wert dieser Währung gegenüber der Fondswährung, so reduziert sich der Wert des Fondsvermögens.
- Kapitalmarktrisiko: Die Kurs- oder Marktwertentwicklung von Finanzprodukten hängt insbesondere von der Entwicklung der Kapitalmärkte ab.
- Wertveränderungsrisiko: Durch die Investitionen des Fondsvermögens in Einzeltitel ergibt sich insbesondere das Risiko von Wertveränderungen der Einzelpositionen.
- Zielfondsrisiko: Der Fonds könnte in Zielfonds anlegen, um bestimmte Märkte, Regionen oder Themen abzubilden. Die Wertentwicklung einzelner Zielfonds kann hinter der Entwicklung des jeweiligen Marktes zurückbleiben
Fonds-/ETF-Portfolios
Soehnholz ESG hat Ende 2015 die ersten Portfolios mit besonders strengen Nachhaltigkeitsregeln entwickelt.
Diese Portfolios können für VermögensverwalterInnen, VermittlerInnen und/oder deren KundInnen individualisiert werden (vgl. Eigen-Portfolios).
Derzeit werden die folgenden Portfolios angeboten:
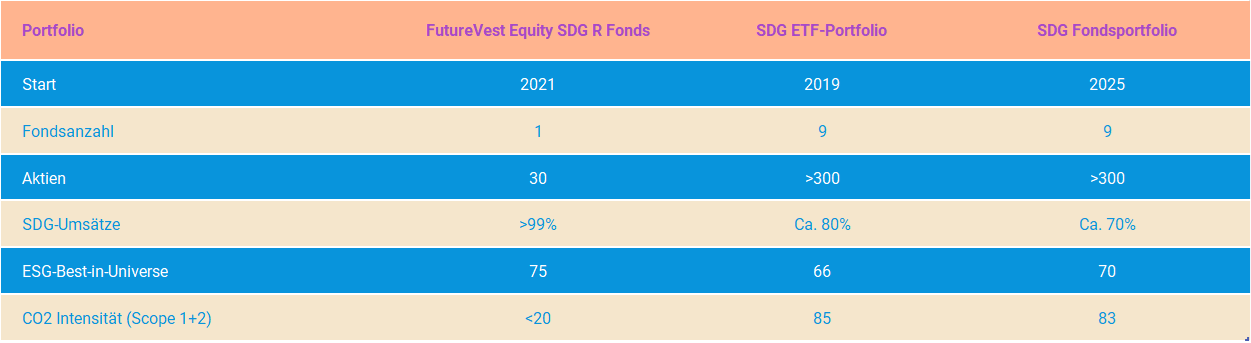
Datenquelle ist Clarity.ai. Diese Daten können sich im Zeitablauf ändern und sollen nur Indikationen geben. Aktuelle Daten werden kooperierenden Partnern zur Verfügung gestellt.
Erläuterungen:
SDG-Umsätze werden aktivitätsbasiert betrachtet und netto ausgewiesen. Sie sind eine Indikation dafür, wie gut ein Portfolio mit den SDG vereinbar ist.
Höhere ESG-Scores sind eine Indikation für geringere ESG-Risiken.
CO2-Intensität gibt die gewichtete durchschnittliche Kohlenstoffintensität in Tonnen CO2e pro Mio. USD Umsatz von Unternehmen aus den jeweiligen Portfolios an.
Das kostenlose FRIPI-Tool der DVFA ermöglicht es, diese Nachhaltigkeitskennzahlen zu einem individuellen Indikator zusammenzufügen.
Soehnholz ESG bietet regel- und evidenzbasierte und günstige Modellportfolios an. Das Soehnholz ESG und SDG Portfoliobuch dokumentiert alle Allokations- und ETF-Selektionsregeln (Kapitel 2), Aktienselektionsregeln (Kapitel 3) und ggf. weiteren portfoliospezifischen Regeln (siehe jeweilige Unterkapitel).
ESG steht für Environmental, Social, Governance Kriterien und SDG für die Sustainable Development Goals der Vereinten Nationen. Gesundheit und erneuerbare Energien gehören dabei zu den wichtigsten Zielsegmenten.
Für die Nachhaltigkeitsbeurteilung wird die Soehnholz ESG Version des „DVFA Framework for Responsible Investment Policies and Impact (FRIPI)“ der Deutschen Vereinigung für Finanzanalyse und Asset Management genutzt (vgl. „Nachhaltigkeitsinvestmentpolitik“ im Das Soehnholz ESG und SDG Portfoliobuch). Basis sind Daten von externen Anbietern wie Clarity.ai. Perfekt nachhaltige Geldanlagen gibt es leider nicht.
Für Soehnholz ESG, ETFs, aktive Fonds, Depots, Wertpapierhandel und ggf. Vermittlungen / Beratungen / Vermögensverwaltungen können Kosten anfallen.
Die Portfolios können grundsätzlich von jedem Vermögensverwalter (gemanagt oder als „Execution Only“ Mandat) angeboten werden. Dazu müssen diese einen Vertrag mit der Soehnholz ESG GmbH abschließen: Mustervertrag
Achtung: Portfolios auf Basis von Einzelaktien erfordern typischerweise erheblich höhere Mindestinvestments als ETF-basierte Portfolios.
Soehnholz ESG bietet keine individualisierten Finanzplanungen, Risikoanalysen oder Anlageempfehlungen, berät keine Anleger und verwaltet keine Portfolios.
Bitte nehmen Sie Kontakt mit uns auf, wenn Sie keinen passenden Verwalter finden.
Eigen-Portfolios
Nachhaltigkeit kann individuell unterschiedlich definiert werden.
Wir bieten vorselektierte Listen von besonders nachhaltigen Aktien als Basis für individuelle Portfolios an.
Die Portfolios können grundsätzlich bei jedem Vermögensverwalter umgesetzt werden.
Beispiel-Selektionstabelle
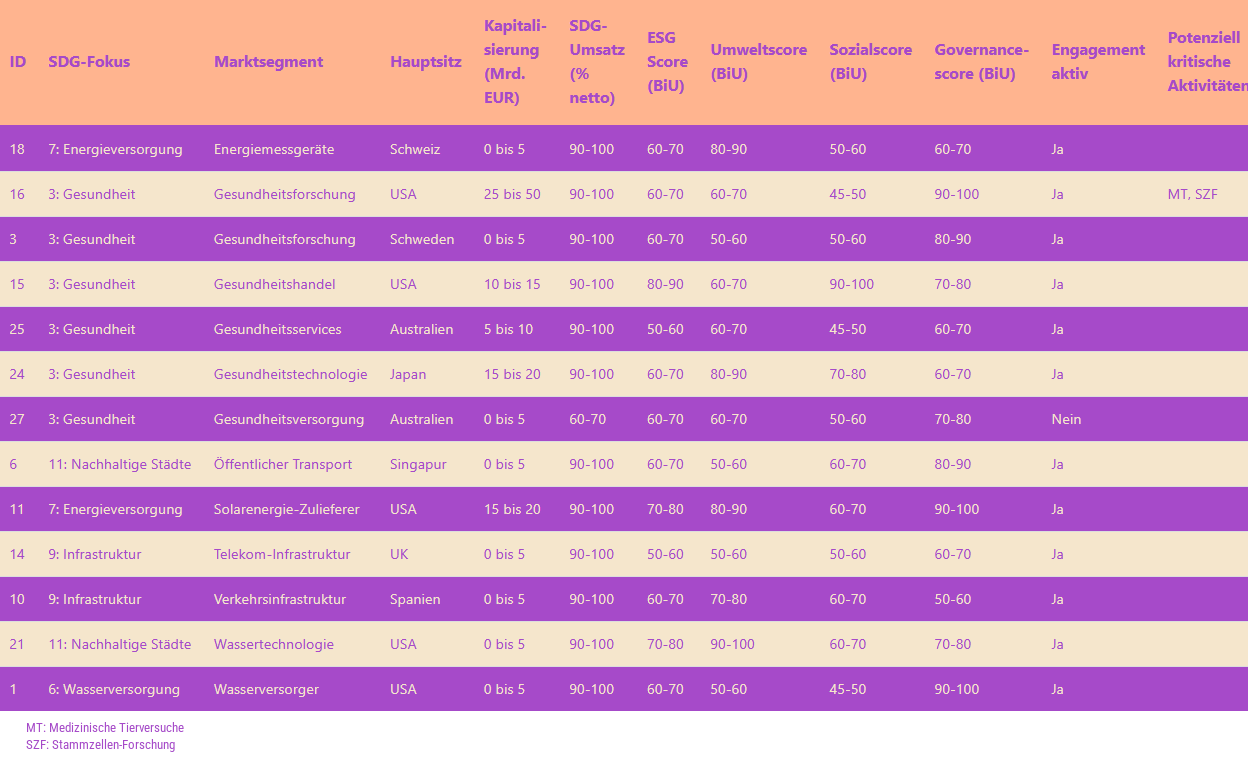
Die vollständige Liste enthält ungefähr 50 bis 100 Aktien, die strenge Nachhaltigkeitskriterien erfüllen. Vereinfacht zusammengefasst sind diese Kriterien: Viele 100% Ausschlüsse, Best-in-Universe E, S und G Risikoscores > 50 von 100 und SDG-Nettoumsätze von mindestens 50%.
Details siehe ESG SDG Modellportfolios in Kapitel 3 in:
Das Soehnholz ESG und SDG Portfoliobuch
Die in der Tabelle genannten E, S, G und ESG-Risikos-Scores geben das Scoring zum Analysezeitpunkt an. Höhere Werte bedeuten weniger Risiko. Quelle für Nachhaltigkeitsinformationen ist Clarity.ai.
Die Tabellen enthalten weder Finanzkennzahlen noch Portfolio- oder Umsetzungskosten. Die Kosten hängen von den Umsetzungspartnern ab (Vermögensverwaltern, Depotbanken, Handelsplätzen etc.).
Die regelmäßig aktualisierte Tabelle wird kooperierenden Vermögensverwaltern mit Aktiennamen und ISINs (Identifikationsnummern) zur Verfügung gestellt.
Die Portfolios können grundsätzlich von jedem Vermögensverwalter (gemanagt, als strukturiertes Produkt oder als „execution only“ Mandat) angeboten werden. Dazu müssen diese einen Vertrag mit der Soehnholz ESG GmbH abschließen: Mustervertrag
Allerdings verlangen Vermögensverwalter oft hohe Mindestanlagesummen für
Einzelaktienportfolios oder unterstützen solche Portfolios gar nicht.
Wenn Interessenten keinen passenden Verwalter finden oder an anderen Aktienlisten interessiert sind, können sie mit uns Kontakt aufnehmen.
Regeln & Hintergründe
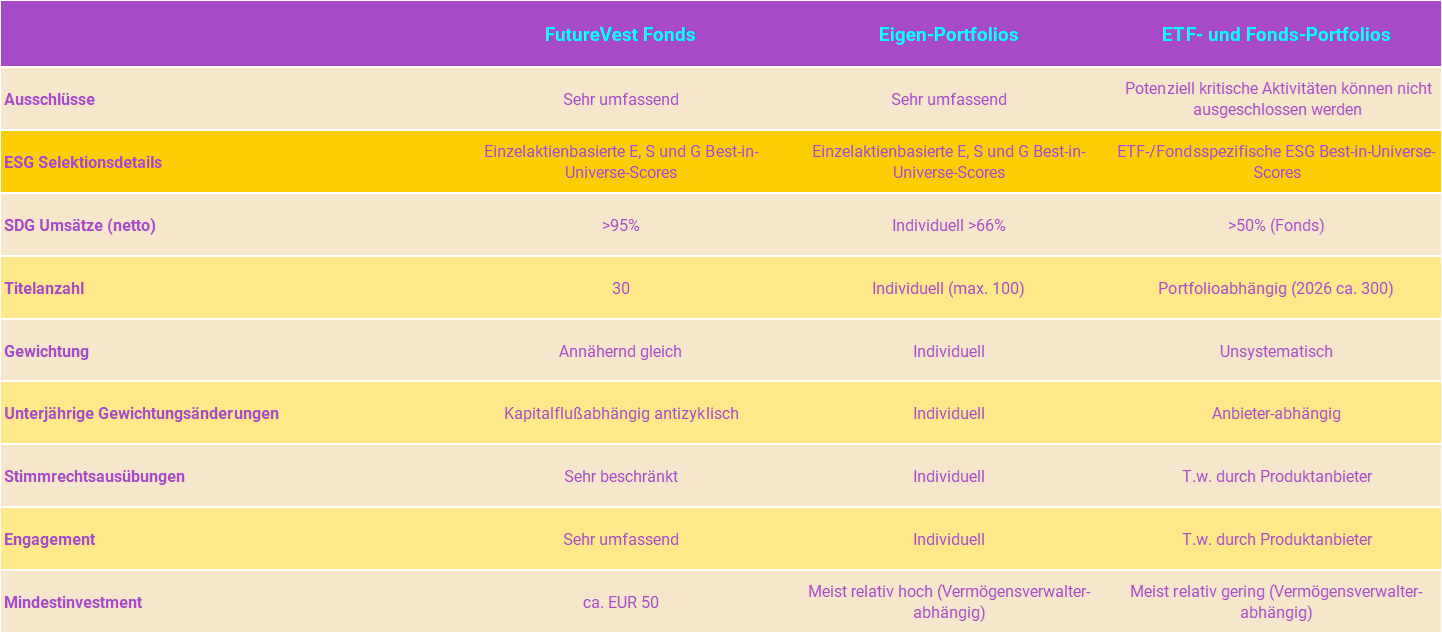
Soehnholz Angebote im Vergleich
Purpose: Verantwortungsvollste liquide Geldanlageportfolios
Dirk Söhnholz ist Gründer, Eigentümer und Geschäftsführer von Soehnholz ESG. Dirk hat sich intensiv mit Praxis und Erforschung von Asset-Allokationen, Risikomanagement und verantwortungsvollen Geldanlagen beschäftigt:
„Ich habe lange nach optimalen Kapitalanlagen für private und institutionelle Anleger gesucht. Was ich gelernt habe: Dauerhafte Outperformance ist nur schwer zu erreichen. Aber relativ einfache regelbasierte und konsequent verantwortungsvolle Investments können sehr attraktiv sein“.
Söhnholz ESG bietet besonders verantwortungsvolle (sustainable) Investmentportfolios an, die marktübliche Performance erreichen sollen. Schwerpunkt sind Portfolios mit klarem Fokus auf die Sustainable Development Goals (SDG) der Vereinten Nationen.
Soehnholz ESG (unter dem Namen Diversifikator) war 2016 der erste Anbieter eines ESG-ETF-Portfolios. Ende 2017 wurde zudem ein innovatives pures ESG+SDG Aktienportfolio gestartet. 2019 kam ein neuartiges SDG ETF-Portfolio hinzu.
Nachhaltigkeitsregeln für die ETF-Portfolios
Für SDG ETF-Portfolios werden nur ETFs berücksichtigt, die möglichst vereinbar mit den Nachhaltigen Entwicklungszielen der Vereinten Nationen (UN SDG) sind. Für diese ETFs sollen mindestens 50% „SDG-Umsatzvereinbarkeit“ erreicht werden. Zusätzlich muss der aggregierte ESG-Score mindestens 50 betragen.
Details zur ETF-Selektion siehe Kapitel 2 im Soehnholz ESG und SDG Portfoliobuch und zur Nachhaltigkeitspolitik siehe Kapitel 7.
Nachhaltigkeitsregeln für die Portfolios aus aktiven Fonds
Die Soehnholz Portfolios aus „aktiven Fonds“ (auch „Fonds-Portfolios“ genannt) nutzen möglichst konsequent nachhaltige Investmentfonds, die nicht börsennotiert sind, aber auch diese Fonds können nicht-nachhaltige Aktien bzw. Anleihen enthalten.
Für die Fonds-Portfolios werden grundsätzlich alle zum Vertrieb in Deutschland zugelassenen Fonds berücksichtigt, deren SDG-vereinbarer Umsatz (netto) mindestens 50% ist und deren Best-in-Universe ESG-Score mindestens 50 von 100 betragen (höhere Scores bedeuten niedrigeres Risiko).
Details zur Fonds-Selektion siehe Kapitel 5 im Soehnholz ESG und SDG Portfoliobuch und zur Nachhaltigkeitspolitik siehe Kapitel 7.
12 Missverständnisse nachhaltiger Investments
5 Fragen zur Auswahl nachhaltiger Investments
Hier ist eine Liste von Fragen, mit denen Interessenten eine passende verantwortungsvolle Geldanlage finden können.
Frage 1: Wollen Sie Ihre liquiden Investments teilweise oder vollständig nachhaltig anlegen?
Nein: Dann können wir Ihnen nicht weiterhelfen.
Ja: Bitte weiterlesen.
Frage 2: Wollen Sie nur in Anlagen investieren, die sicher immer zu 100% "gut" sind?
Ja: Spenden Sie Ihr Geld lieber, denn solche Anlagen gibt es unseres Wissens nicht.
Nein: Bitte weiterlesen.
Frage 3: Wollen Sie vor allem Wertpapiere im Portfolio haben, die Produkte und Services anbieten, die möglichst gut vereinbar mit den nachhaltigen Entwicklungszeilen der Vereinten Nationen sind?
Ja: Bitte weiterlesen.
Nein: Dann könnten ESG ETF-Portfolios für Sie interessant sein.
Frage 4: Sind Ihnen niedrige Kosten besonders wichtig oder höhere Nachhaltigkeit?
Niedrige Kosten: Dann könnten unsere SDG ETF-Portfolios für Sie interessant sein.
Höhere Nachhaltigkeit: Dann könnten unsere SDG Fonds-Portfolios, unser Fonds oder unsere Eigenportfolios für Sie interessant sein.
Frage 5: Sind unsere Nachhaltigkeitsregeln passend für Sie oder wollen Sie Portfolios mit eigenen Nachhaltigkeitskriterien zusammenstellen?
Passend: Bestens!
Eigene Kriterien: Sehen Sie sich unsere Eigen-Portfolios an oder sprechen Sie uns (ds@prof-soehnholz.com) auf andere Nachhaltigkeitsportfolios an.
Weiterführende eigene Informationen
Das Soehnholz ESG Unternehmenskonzept, die Investmentphilosophie, das Vorgehen für die diversen Portfolios, Rückrechnungen und mögliche Fragen und Antworten sind in „Das Soehnholz ESG und SDG Portfoliobuch“ zusammengefasst.
Hier können Sie das Buch von Dirk Söhnholz et al. bestellen: Asset Allocation, Risiko-Overlay und Manager-Selektion: Das Diversifikationsbuch, Gabler 2010
Videos und Podcasts
Video: Wie viel Impact haben Impact-Fonds tatsächlich? ESG-Experte sieht großes Verbesserungspotenzial (fundview.de), 4. November 2021
Video: ESG-Experte Dirk Söhnholz über ESG-Mythen im Asset Management (fundview.de), 29. Oktober 2021
Video: ESG-Experte Dirk Söhnholz: „Viele aktive nachhaltige Fonds sind nicht nachhaltig“ (fundview.de), 27. Oktober 2021
Audio: 19. Hedgework-Talk: „Die Nachhaltigkeits-Regulierung alleine bringt den Anlegern nicht viel“ – HEDGEWORK, 20. Oktober 2021
Video: Regulierungsprävention für Vermögensverwalter, 20. Oktober 2020
Audio: SRI-ETFs sind für Stiftungen fast Pflicht – Der Stiftungsblog für die Stiftungspraxis (stiftungsmarkt-platz.eu), 14. Februar 2020
Video: Mehr als 20 Mini-Lernvideos: Evidence Based Investment Analysis (EBIA), e-Seminar der Finanzakademie der Deutschen Vereinigung für Finanzanalyse und Asset Management (DVFA), September 2018
Externe Quellen und Tools
Bei UN SDG Learn Kurse zu den SDG an.
Das Umweltbundesamt bietet einen persönlichen CO2-Rechner an.
Zur Einschätzung der persönlichen Risikotoleranz kann Portfoliocharts nützlich sein. Z.B. die Grafik „Real return by investing period“ ist hilfreich für Risikoeinschätzungen diverser Anlagesegmente und Allokationen.
Für die Bestimmung einer nachhaltigen Geldanlagepolitik kann das DVFA FRIPI Tool helfen, das ich mitentwickelt habe.
Für die liquide Asset-Allocation ist Portfoliovisualizer besonders interessant (Erläuterung z.B. hier: Kann institutionelles Investment Consulting digitalisiert werden? Beispiele)
Kostenlose Nachhaltigkeitsdaten erhalten Privatanleger hier: MSCI (für Aktien und Indizes) Sustainalytics (für Aktien) Globalance Refinitiv S&P Impaakt CSRhub moneycare und Wikirate (für Aktien) sowie MeinFairmögen Facing Finance Cleanvest FNG Moningstar ISS und TrackInsight (für Fonds) Upright und Robeco (Aktienimpact) Violation Tracker (Klagen gegen Unternehmen) und PRI-Resolutions (Aktionärsengagements). Diese Anbieter nutzen meist Best-in-Class und aggregierte ESG-Ratings und die kostenlosen Daten enthalten nicht unbedingt alle aktuellen Informationen.
Unternehmen können ihre Nachhaltigkeit zum Beispiel mit dem CSP-Radar prüfen.
Interessante und überwiegend kostenfreie neue Beiträge zum Thema Nachhaltigkeit und Investment findet man zum Beispiel hier:
Über uns
2007 habe ich einen Sustainable Private Equity Dachfonds, ab 2012 mehrere ESG-Aktienfonds, 2015 ein ESG ETF-Portfolio, 2017 ein SDG-Aktienportfolio und 2019 ein SDG ETF-Portfolio (mit) entwickelt. Inzwischen biete ich nur noch SDG Portfolios an.
Die Soehnholz ESG GmbH wurde 2015 als Diversifikator GmbH gegründet, um Modellportfolios anzubieten. Das gezeichnete Kapitel beträgt EUR 50.000. Die Gesellschaft gehört zu 100% der Söhnholz Advisors GmbH.
Die Söhnholz Advisors GmbH wurde 2002 als Söhnholz Private Capital GmbH gegründet, um Unternehmensbeteiligungen der Familie Söhnholz zu verwalten. Dirk Söhnholz ist alleiniger Gesellschafter und Geschäftsführer der Gesellschaft (HRB 7758, Amtsgericht Bad Homburg). Anschrift der Gesellschaft ist c/o Dirk Söhnholz, Bahnhofstr. 35, 63067 Offenbach. Das gezeichnete Kapital beträgt EUR 50.000. Die Soehnholz Advisors GmbH hält 100% an der Soehnholz ESG GmbH und 100% an der Soehnholz Asset Management GmbH.
Die Soehnholz Asset Management GmbH wurde 2020 gegründet, um Investmentfonds zu beraten. Die Gesellschaft ist unter dem Haftungsdach der DWPT Deutsche Wertpapiertreuhand GmbH tätig. Anschrift der Gesellschaft (HRB 119333, Amtsgericht Frankfurt am Main) ist c/o Dirk Söhnholz, Bahnhofstr. 35, 63067 Offenbach. Das gezeichnete Kapital beträgt EUR 25.000.
Prof. Dr. Dirk Söhnholz
Soehnholz ESG ist “80% anders”
Wissenschaftlich evidenzbasiert
Regelbasierte Investmentphilosophie
Selektionsfokus auf SDG Kriterien („Pure“ SDG)
Pionier von ESG-ETF und ESG+SDG Aktienportfolios
B2B Modellportfolioanbieter
Einfach individualisierbare nachhaltige Portfolios
Freie Vermögensverwalterwahl
Unabhängig u.a. von Produkt- und Serviceanbietern, Portfoliomanagern, Prognosen, Optimierungen
Lebenslauf
Berufserfahrung
5/20 – heute Geschäftsführer der Soehnholz Asset Management GmbH (Teilzeit)
1/20 – heute Senior-Partner Deutsche Wertpapiertreuhand GmbH (Teilzeit)
3/16 – heute Geschäftsführer der Soehnholz ESG GmbH (ehemals Diversifikator GmbH)
11/15 – heute Geschäftsführer der Söhnholz Advisors GmbH (inaktiv)
8/13 – 10/15 Geschäftsführer der Veritas Portfolio Management GmbH (bzw. der „Veritas-Holding“ für Veritas Investment und Veritas Institutional), Sprecher der Geschäftsführung
8/12 – 10/15 Geschäftsführer der Veritas Investment GmbH, Sprecher der Geschäftsführung seit April 2013
6/11 – 7/12 Geschäftsführer der Söhnholz Advisors GmbH, dabei 1/12 – 5/12 Senior Advisor der Augur Capital AG, Frankfurt
9/05 – 5/11 Geschäftsführer der Feri Institutional Advisors GmbH, Bad Homburg
10/03 – 9/05 Managing Director für Alternative Assets der Feri Trust GmbH, Bad Homburg, und Partner der Feri Finance AG (bis 4/11)
11/99 – 10/03 Gründer, Anteilseigner und Alleingeschäftsführer der Feri Private Equity GmbH bzw. Feri Alternative Assets GmbH, Bad Homburg
11/98 – 10/99 Geschäftsführer/Finanzvorstand der TelePassport GmbH/AG, Erfurt
10/96 – 10/98 Bereichsleiter Controlling/IT der Gerresheimer Glas AG, Düsseldorf
7/93 – 9/96 Projektleiter/Manager bei der Boston Consulting Group in Monterrey/Mexico
4/91 – 6/93 Unternehmensberater bei der Boston Consulting Group in Düsseldorf
Ausbildung
1988 – 1991 Promotionsstudium Universität Mannheim (Dr. rer. pol.), Dissertationsthema „Diversifikation in Finanzdienstleistungsmärkte“
1986 – 1987 Master of Business Administration (Spezialisierung in Finanzen), Baruch College/City University of New York; Fulbright und Baruch College Stipendiat, Beta Gamma Sigma
1985 – 1988 Studium der Betriebswirtschaftslehre (Diplomkaufmann), Universität Mannheim
1983 – 1985 Studium der Betriebswirtschaftslehre (Vordiplom), Universität Bayreuth
1982 – 1983 Wehrdienst, Munster/Niedersachsen
1969 – 1982 Grundschul- und Gymnasialbesuch in Eicklingen/Niedersachsen, Teheran/Iran und Celle/Niedersachsen
Weitere Informationen
5/24 – heute: Aufsichtsrat der Taunus Trust AG
12/19 – heute: Portfolio Institutionell Award Jurymitglied Portfoliostruktur
8/18 – heute: Mitglied DVFA Kommission Sustainable Investing
2/14 – heute: Honorarprofessor für Asset Management an der Universität Leipzig
10/13 – 10/15 Mitglied des Augur Experts Board
1/13 – 10/15 Mitglied im Ausschuss Altersvorsorge des Bundesverbandes deutscher Investmentgesellschaften (BVI)
2/12 – 9/12 Aufsichtsrat der Pall Mall Investment Management GmbH, Hamburg (heute: Veritas Institutional GmbH)
4/12 – heute: Lehrbeauftragter für Asset Management an der Universität Leipzig
2007 – 2011 „Judge“ der IPE European Pension Fund Awards für mehrere Kategorien, vor allem Immobilien
10/07 – 6/11 Geschäftsführer Institutional Trust Mgt. Co. S.á r.l. (UCITS ManCo), Luxemburg sowie weiterer Luxemburger Managementgesellschaften (t.w. seit 2005)
2002 – 2012 Ehrenamtlicher Vorstand Bundesverband Alternative Investments, Bonn, des deutschen „Diversifikationsverbandes“
12/02 – heute Geschäftsführender Gesellschafter der SPC Söhnholz Private Capital GmbH, der späteren Söhnholz Advisors GmbH, Friedrichsdorf
1984 – 1992 Stipendiat der Konrad-Adenauer-Stiftung
1963 Geboren in Hannover/Niedersachsen
Verheiratet, 4 Kinder. Hobbies: Lesen, Tischtennis
Mehr für Profis (B2B)
Soehnholz ESG GmbH is an independent B2B model portfolio provider for German clients, offering portfolios with focus on the United Nations Sustainable Development Goals.
All portfolios are based on simple and transparent rules using mainly ESG and SDG criteria for ETF and stock selection (Pure ESG and Pure SDG approach).
Contact: Prof. Dr. Dirk Söhnholz, ds@prof-soehnholz.com
Wir sind an einer Zusammenarbeit interessiert mit Anlageberatern, Banken, Finanzplanern, Fintechs, Vermittlern, Vermögensverwaltern und Versicherungen (im Folgenden „Partner“ genannt). B2B Partner können Portfolios bzw. Services direkt von der Soehnholz ESG GmbH oder indirekt (Vermittler) z.B. über die DWPT Deutsche Wertpapiertreuhand GmbH beziehen. Wir bieten sehr flexible Möglichkeiten der Zusammenarbeit auch als Private Label oder White-Label Angebot.
Portfoliovermittlung
„Partner“ bietet bestehende Soehnholz ESG Portfolios an. Die Kosten dafür betragen typischerweise 25% der Partner-Einnahmen, also 0,25% bei einer Vermögensverwaltungsgebühr von 1% pro Jahr. Dafür haben wir einen Standardvertrag erarbeitet (siehe unten).
Portfolioentwicklung
Schwerpunkt der Portfolioentwicklung sind regelbasierte SDG-Portfolios aus Aktien, ETFs oder anderen Fonds.
Fondsberatung
Investmentfondsberatung, auch für Art. 9 SFDR Fonds, wird über die Soehnholz Asset Management GmbH unter dem Haftungsdach der DWPT Deutsche Wertpapiertreuhand GmbH angeboten.
Beratungsunterstützung
Maßgeschneiderte Online- und Offlineveranstaltungen und (videobasierte) Unterstützung bei Gesprächen mit Interessenten und Kunden u.a. mit DFVA FRIPI, dem von Dirk Söhnholz mit entwickelten „Framework for Responsible Investment Policies and Impact“ des Deutschen Verbandes für Finanzanalysten und Assetmanager.
Fallbeispiel / Referenzkunde DWPT Deutsche Wertpapiertreuhand GmbH
„… Berater und Mandanten der Deutschen Wertpapiertreuhand erhalten … Zugang zu weiteren 16 Anlagestrategien. … Darüber hinaus wird Prof. Söhnholz institutionelle und UHNW-Mandanten der Deutschen Wertpapiertreuhand individuell beraten. Diese Beratung erfolgt grundsätzlich in Teamarbeit mit weiteren Senior Partnerinnen und Partnern der Deutschen Wertpapiertreuhand. Marcel van Leeuwen, Geschäftsführer und Gründer der Deutschen Wertpapiertreuhand …: „Lange bevor Nachhaltigkeit eine Bedeutung in der breiten Öffentlichkeit bekam, hat Dirk Söhnholz schon erfolgreich streng nachhaltige Investmentportfolios entwickelt. Wir freuen uns sehr, zusammen mit ihm unser Angebot im ETF, ESG sowie im Impact Investing auszubauen.“ (Quelle: DWPT-Pressemitteilung vom 13.1.2020)
B2B Dokumente
Präsentation für interessierte Partner auf Anfrage
Vertrag für das Angebot von Portfolios
Archiv